A History of Choice Mapping
In a previous post, I forgot to link some choice choicemaps I’d stumbled across at Demian’s Gamebook Web Page and elsewhere. They inspired me to blog at greater length than before about the history and variety of choice maps. I learned too much in the process; I wouldn’t have even begun if I’d realized how much was really out there. Like gamebooks themselves, choicemaps have been reinvented so many times it’s difficult to establish any sort of priority.
As Demian would say, all trademarks and graphics below remain the property of their respective owners and are used here solely for the educational purpose of documenting the history and scope of choice mapping. No infringement is intended. Images link to their sources when still available online and/or not already cited.
1930
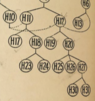
The first choice maps appeared in the first hypertext, Consider the Consequences! by Doris Webster and Mary Alden Hopkins, in 1930. The style was a layered graph with no distinctions made between different types of nodes; paragraph numbers from the text were used as node labels. It’s surprisingly prescient for a first try; this is by far the most common style of choice mapping to this day.
1967
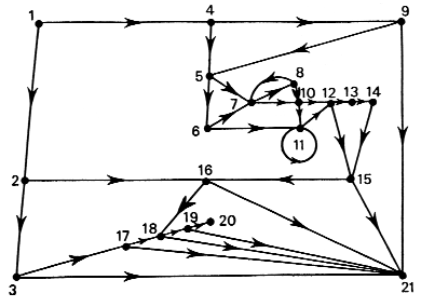
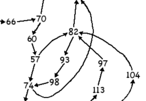
The computational origins of gamebooks in previous forms of combinatory literature (rather than in the first, forgotten, gamebook) are perhaps best seen in the work of Raymond Queneau, member of the Oulipo (Ouvroir de Littérature Potentille/Workshop for Potential Literature) and author of the first gamebook-style short story, “Un conte à votre façon”. (You can play the story online, or read it as originally formatted.) Queneau took his inspiration from computer instructions and also graphed the story using arrows and paragraph numbers, though it’s not clear from my source whether the drawing of the story below is his original or Claude Berge’s reproduction.
This year also saw the publication of Lucky Les by E. W. Hildick, a British children’s book about the reader-directed adventures of a lucky young cat.
1969
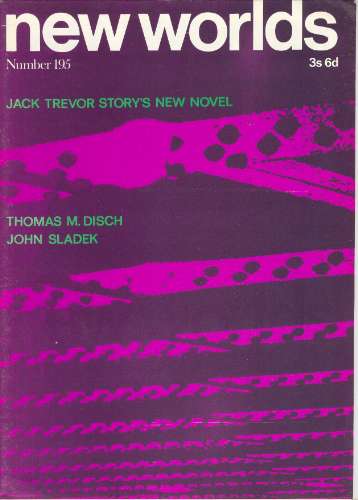
This year marks the composition of Sugarcane Island by Edward Packard, and the publication of not one but two interactive novels for adults coauthored by Dennis Guerrier: State of Emergency and Sleep and the City Trembles. John Sladek’s “Alien Territory” was published in New Worlds magazine issue #195; it was a strange interactive short story of 36 paragraphs which was itself little more than a choicemap. “Alien Territory” is currently available in (and perhaps on) Maps: The Uncollected John Sladek.

(1970’s)
In 1972, the first volume of the first gamebook series, Tracker Books, was published by Transworld Publishers.
In 1976, Sugarcane Island was finally published, by Vermont Crossroads Press. The first RPG-style gamebook, Buffalo Castle, was also published that year.
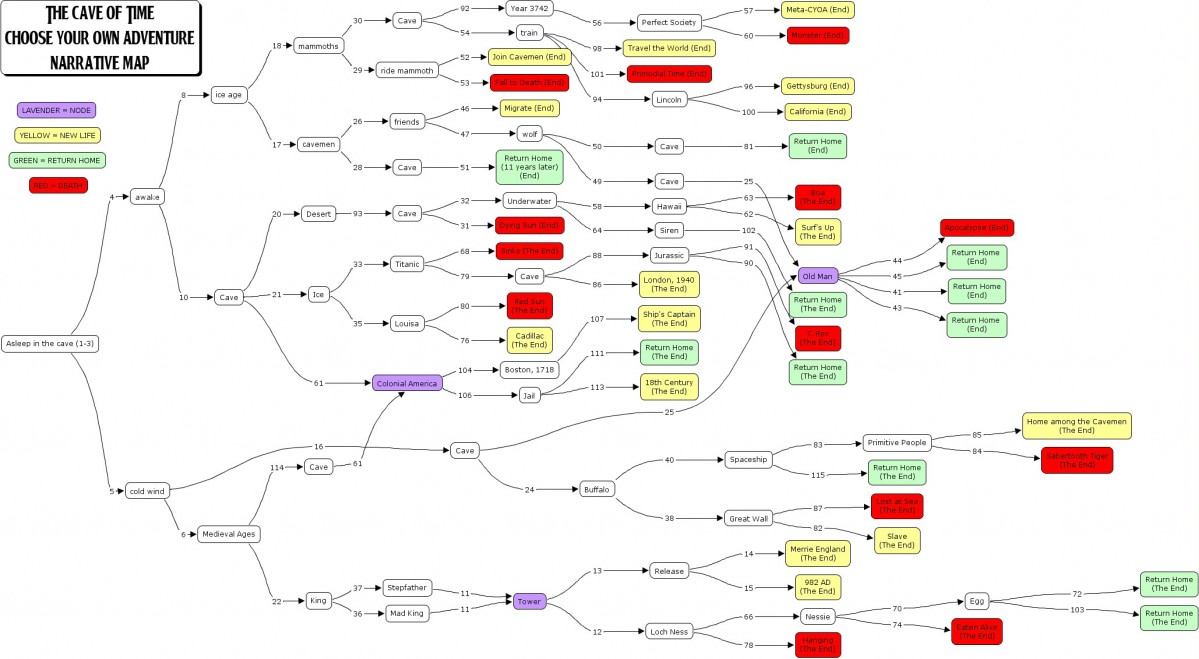
Several more of Packard’s works followed before Bantam rebranded the series “Choose Your Own Adventure” and published the first volume of that series, Packard’s The Cave of Time, in 1979.
1984
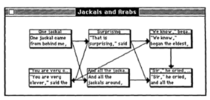
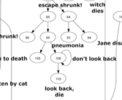
The authors of CYOA-style children’s books in the 80’s also created choicemaps. Jay Leibold (Jay Montavon), for example, took a flowchart-like approach to graphing his novels Sabotage (1984) and Grand Canyon Odyssey (1985). Note the innovations of circling the end nodes and left-to-right orientation. Some converging paths are drawn in, but usually he just notes the (page?) number to which a non-end node connects. Some nodes are annotated with text descriptions.

(The first Fighting Fantasy gamebook was published in 1982, and the first Lone Wolf in 1984.)
1987
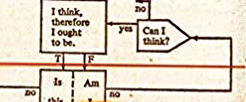
The hyperfiction program Storyspace was released thirty years ago, at which point it already featured manual layout of choice maps during story composition. The manual approach and wordy node style sets the standard for other (much later) hyperfiction creation software.
(1998)
Bantam ceases publication of the Choose Your Own Adventure books at volume #184, Mayday!, by Edward and Andrea Packard. (The legend of #185 is a matter of some controversy.)
2001
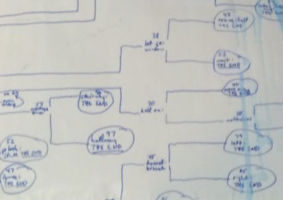
The oldest surviving choicemap of the internet era seems to be Demian Katz' hand-drawing of Sugarcane Island as part of an essay comparing the various editions of the second gamebook ever written (after Consider). The Wayback Machine captured his essay in October of 2001, but presumably the images were there when he announced it to the Yahoo gamebooks group on August 15th, more than two years before the choicemap generally rumored to be first online. Note the single-circled nodes, double-circled ends, lack of any explanatory text, and the tree-like bottom-to-top orientation. Because this is a comparison of two editions with different page numbering, the node numbers are arbitrary; a key connects them to actual page numbers.
Update: The oldest documented choicemap of the internet era was created automatically by Ingo Klöcker using GraphViz (of course) in January 2001, as an aside in a discussion of link-checking HTML gamebooks using shell scripts for Project Aon. Thomas Wolmer continued working in this automated vein in 2002 and 2003 using Perl to create clickable GraphViz choicemaps like those described in the 2006–2007 section below. These early choicemaps don’t appear to have survived online, though Thomas Wolmer, who prompted this correction, has also kindly provided links to the software and a 2003-style graph.
2003
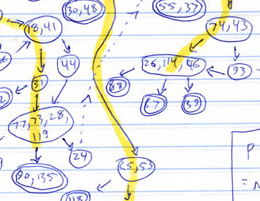
As part of his spotty history of CYOA visualizations, Mark Sample puts the dawn of choicemapping online at September 2003, when Andrew Stern posted a handwritten map of the recently-released Night of a Thousand Boyfriends. Note the circled page numbers (with multiple numbers in one circle in the case of non-choice links), double-circled endings, and highlighting of the main paths.
2004–2005
Sample continues his history with an HTML image map and analysis of The Third Planet from Altair from 2004, and Sample’s own curvy flowchart of The Cave of Time in 2005. The image map is perhaps the most complex rendering of a choice map to date, including three ranks of endings (with tombstones for deadly ends), major paths arranged spatially, annotation with story and choice details, and color-coding of some other features of paths and choices. Sample’s own map includes three ranks of endings plus one feature of nodes, all color-coded, and a left-to-right orientation.

In 2005, Chooseco began reissuing some renumbered Choose Your Own Adventure books, though it’s not clear when exactly they created their new style of choice mapping for the reprint series. The Chooseco maps are quite abstract, including no page numbers and using purely random coloration, though they do distinguish choices from ends by shape. Below is a portion of a map of a story with only 9 endings and many sequences of pages (symbolized by triangles) without choices—or “walls of text”, as they would be called in online hyperfiction:

Also in 2005, a prototype tree of Give Yourself Goosebumps #4 was posted to the gamebooks mailing list, produced by a dedicated choicemapping software project that was apparently never released. It included some unexplained color-coding of links and (separately) page numbers, as well as circled end nodes.
2006–2007
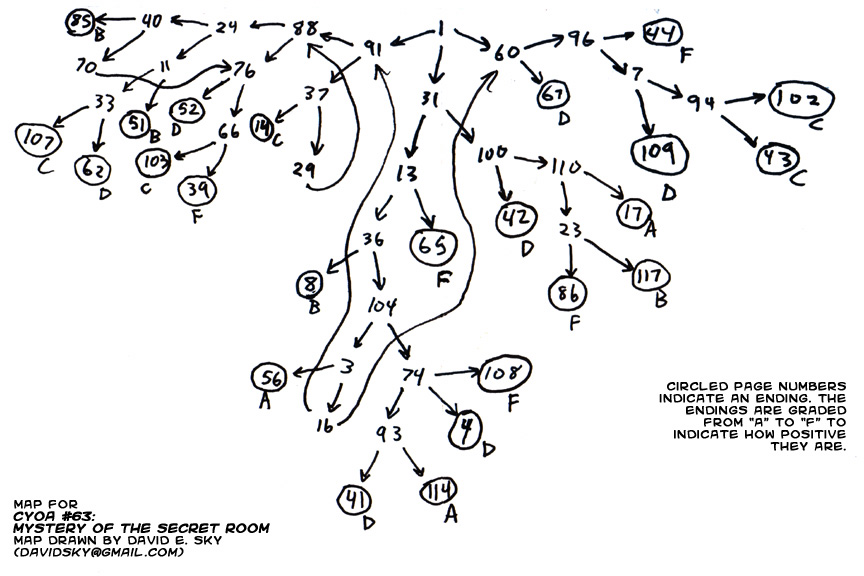
Sample overlooks the work of David Sky, Julien Peter Benney, Simon Osborne, and others during this period. Sky began a series of hand-drawn maps in March 2006 or earlier, using circled ends with six ending ratings (A–F). His mapping efforts weren’t restricted to the Choose Your Own Adventure series. Benney created a similar set of maps of the Time Machine series, some made from memory, starting in August 2007 or earlier, with circled, but unrated, ends.
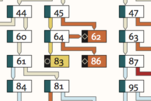
In 2006 there were already vast numbers (50+) of Fighting Fantasy and related gamebooks flowcharted (since for FF fans the map is a separate document) and posted online by Simon Osborne and a few other gamebook fans. These are not actually flowcharts but layered graphs, mostly made with Graphviz, posted on the web and/or to the Yahoo!Groups gamebooks mailing list. A couple of Choose Your Own Adventure volumes were included, including, of course, The Cave of Time.
You can still find work from this period at the Fighting Fantasy site (under Solutions), the Outspaced Shrine, Project Aon, and in the Yahoo group. Some were graphed entirely automatically from online sources, though the software to do so was apparently never made public.
Update: See the update to 2001 above for the early software, or inquire at Project Aon for the current version. Note also that the nodes are linked to gamebook pages for their hosted gamebooks, e.g., the Lone Wolf example above.
2008–2009
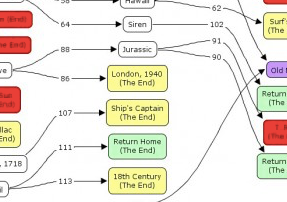
Sample jumps ahead to Sean Michael Ragan’s 2008 Graphviz layered graph of The Curse of Chimney Rock, and Michael Niggel’s 2009 blocky, colorful map of Journey Under the Sea.
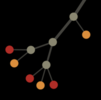
Sample’s review ends in 2009, at the point where Christian Swinehart’s visualizations using David Sky’s map data blow all other choice maps out of the water. He made both force-directed graphs with ends colored according to Sky’s rating system, and unique linear graphs ordered by page numbers, with forward links going above the line and backward ones going below the line, for ten classic Choose Your Own Adventure books plus a few similar works.

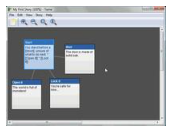
Also in mid-2009, Twine was released. (Twee had existed for a few years before that.) Twine was not notable for the graph style, which was manually laid out just like Storyspace two decades before, but for bringing choice-mapping (as an inescapable part of the hyperfiction writing process) to the masses.
2011
In January 2011, authors return to the mapping task, when Rudolf Kerkhoven hand-plots a map for The Redemption of Mr. Sturlubok.

In August 2011, Sam Kabo Ashwell started mapping stories at the usual starting point, The Cave of Time, in a style that looked laid out by hand, and continued to map an immense quantity of both print and online choice fiction.
2012
Although Twine was released in 2009, it wasn’t until December 2012 that Wired reported it being used to graph a paper book, the Kickstarted CYOA version of Hamlet. Inklewriter was released in early 2012, and does generate layered graphs automatically from story text entered into a more linear writing interface, when you switch to map mode. Terence Eden blogged a partial Inklewriter map of his 2015 Twitter-based hyperfiction story.


2013
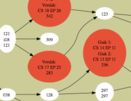
Rudolf Kerkhoven adopts more technology to map Can Stuart Henry Zhang Save the World?, using LucidChart and apparently clustering nodes by subplot using color (presumably manually). Separate nodes are used to indicate the (preceding) end nodes.

2015
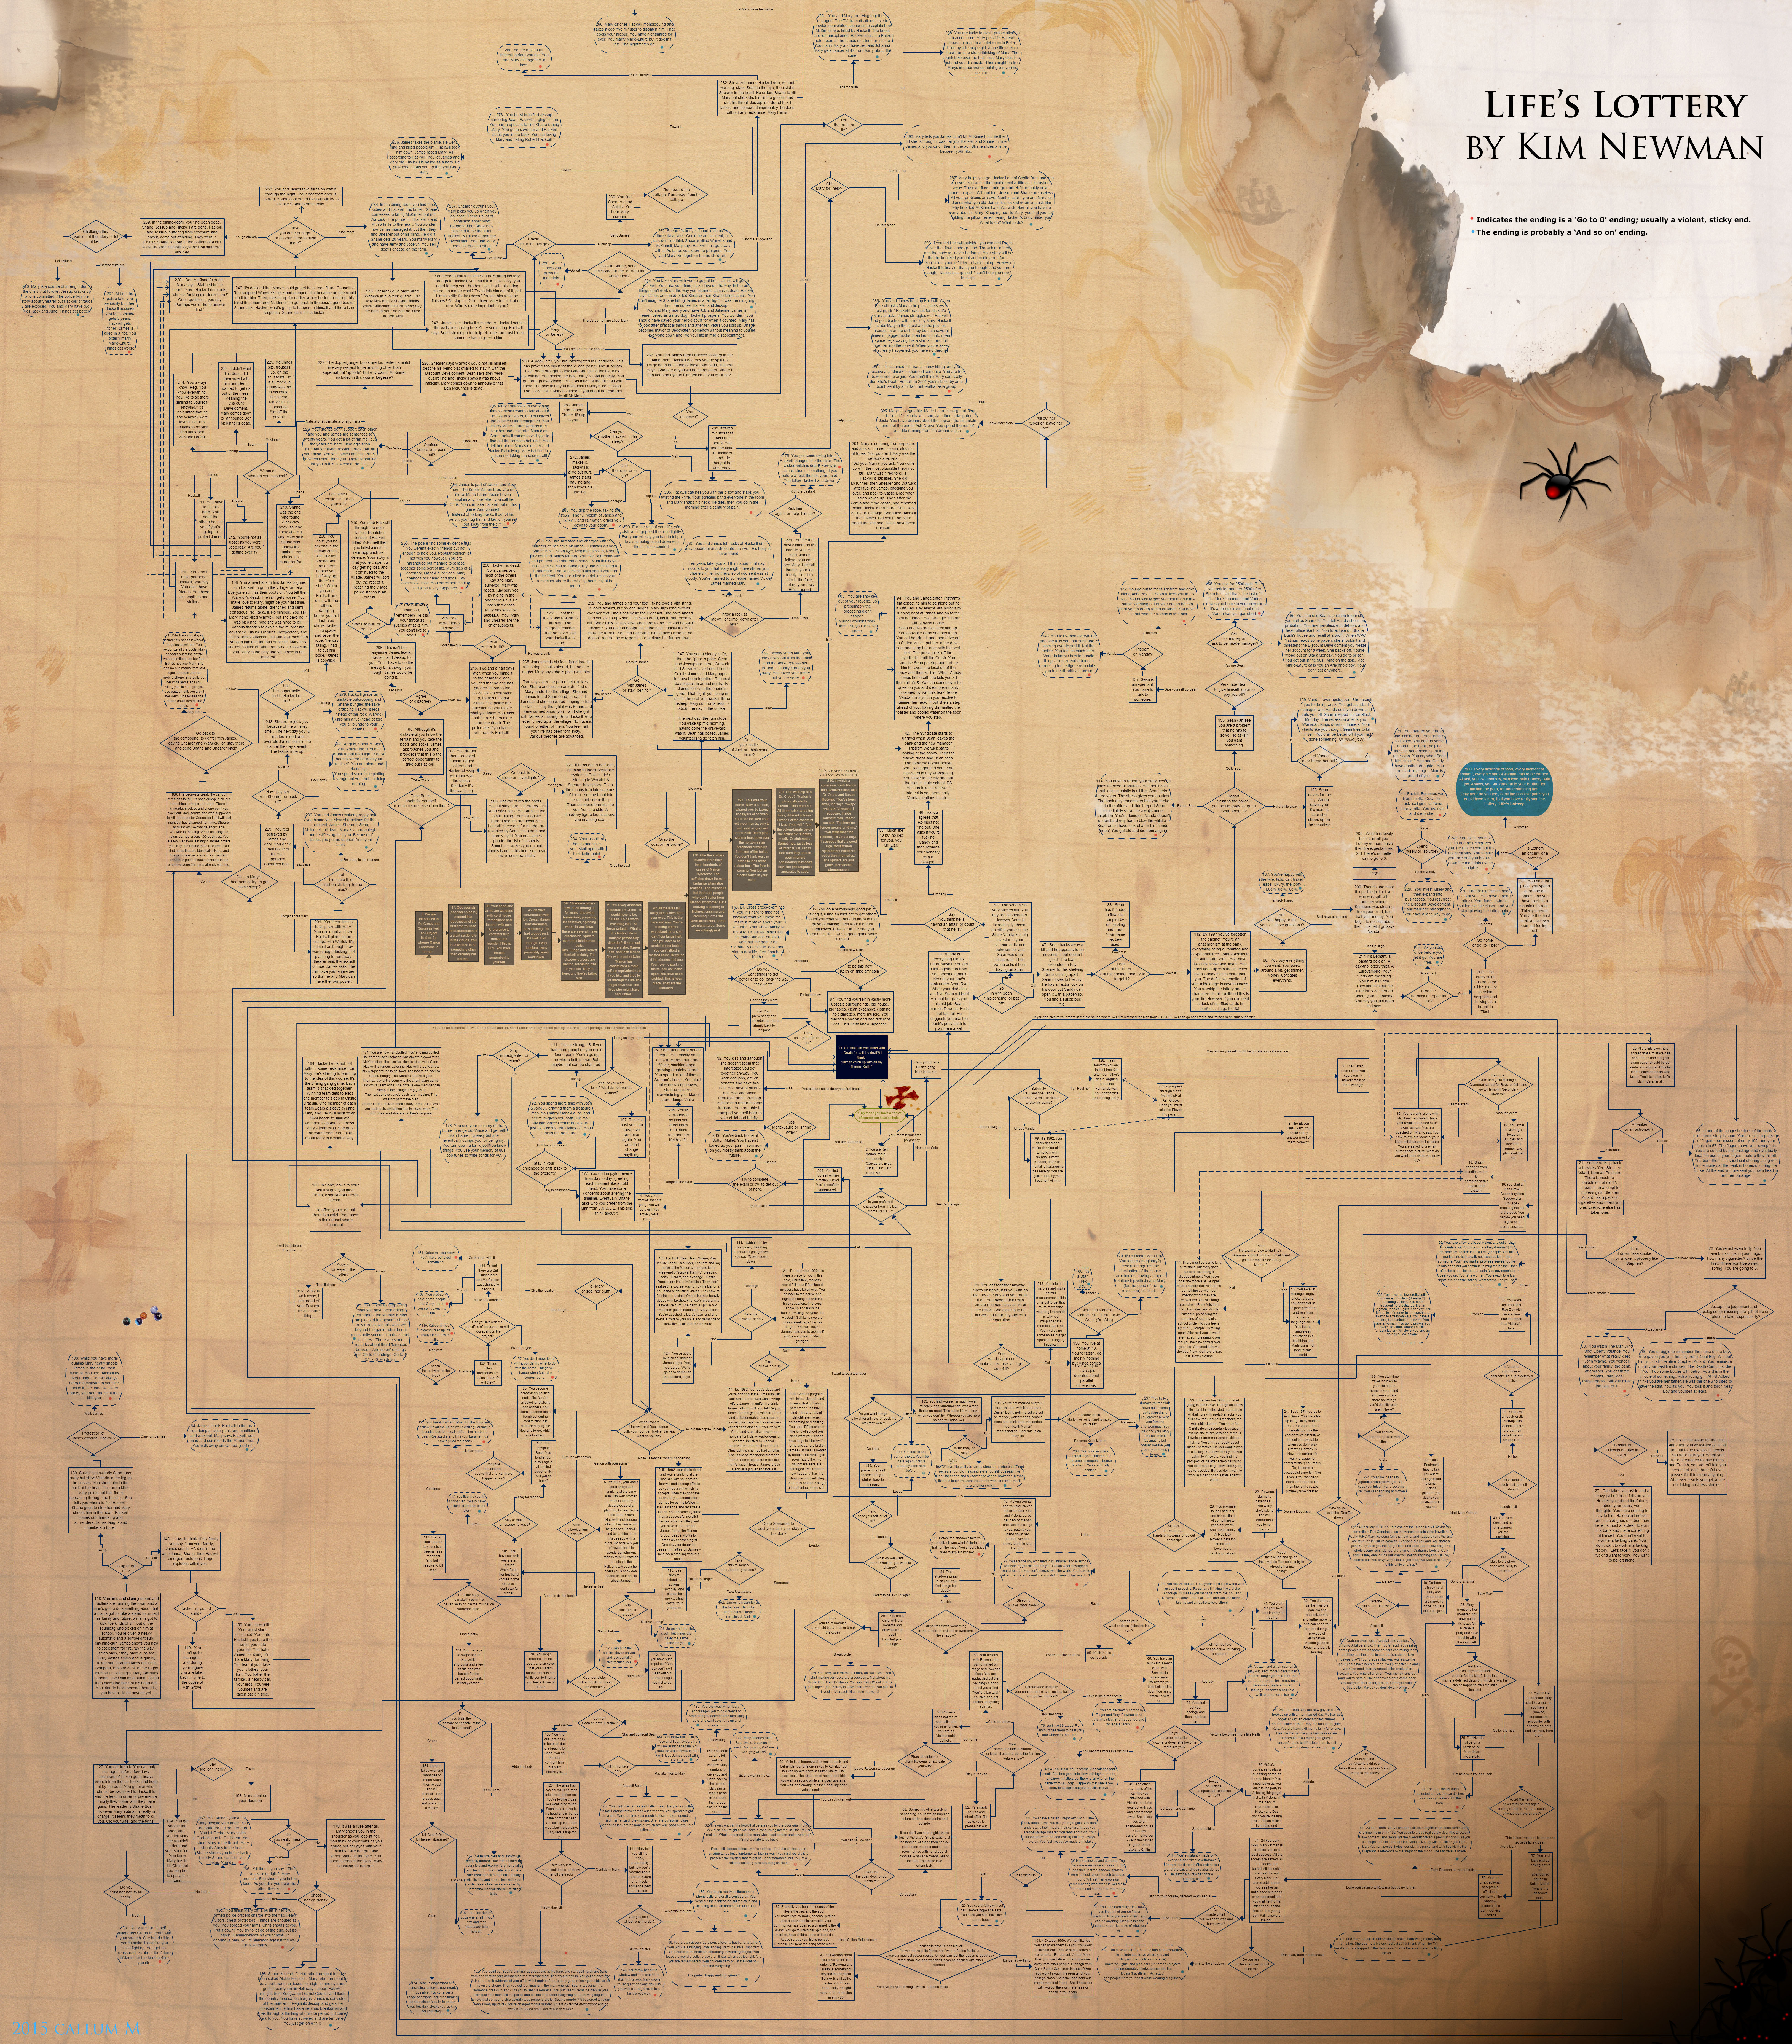
In 2015, Callum MacKendrick’s elaborate, manually-laid-out flowchart of Life’s Lottery was posted to Demian’s Gamebook Web Page. This one is literally a flowchart, with diamond nodes for choices and square ones for no-op pages. Endings are circled with dashed lines and are color coded (a small dot) for death vs. non-death. All nodes are wordy; the paragraph numbers are there, too, but not obvious.
2016
Candase Hokanson made a decision tree map for The Antimatter Formula in 2016, as well as a decision table. On the face of it, the decision tree looks a bit different, but it’s actually a layered graph like the Graphviz examples.
Even in 2016, automatic layout was still rare in hyperfiction software, and to make up for this particular failing in my own toolchain, I created DotGraph, the only public, dedicated choice mapping software I’ve found. DotGraph generates the getting-to-be-traditional style of layered choice map for any Twine story, using Graphviz. DotGraph supports color-coding of nodes, choice-labeling of nodes, end node styling, and clustering (though some functionality requires tags in the source file), and redirecting the graph in any of the four directions.

2018–2019 (Update)
Bandersnatch premiered in December, chock full of its own choicemaps, and inspired an immediate outpouring of viewer choicemaps and much subsequent analysis, including my four-part blog series about the maps.

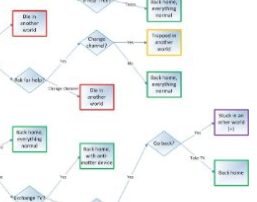
In A Cosmic Flowchart (Part I), I covered the fictional, meta-choicemaps shown in Bandersnatch. In Part II, I covered some of the earlier and more popular actual maps of the show as played (and frequently mapped) by the viewers. In Part III, I surveyed the later and less noted maps of the show, in roughly chronological order. Lastly, in A Cosmic Epilogue, I tacked on the map to end all maps.


Joe Depeau at Neo4J was inspired by Bandersnatch to use his company’s graph database to map out Choose Your Own Adventure #31, Vampire Express by Tony Koltz (1984):

He goes on to use the database to look for easter eggs (there were none) and to find the shortest and longest paths through the story (with Cypher queries rather than eyeballing it). He discusses some other questions you can ask in a graph database, if you start out with more data than he entered—e.g., the text of the nodes. Though he only speculates about the potential benefits to authors and was hardly going to blog about the overhead of using a boutique database system on a blog about that boutique database system, the use of a graph database represents a significant advance in the field of choice mapping.
This year has yielded some meta-graphing as well, of clusters of Twine stories:

Unfortunately there are no graphs of the stories themselves, nor of the common graph elements that produced the clusters. Hopefully more research will follow.
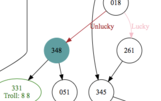
In his August review of the recent boardgame version of the CYOA classic House of Danger, Sam Kabo Ashwell mapped the game, marking its unique clue card sub-paths as round nodes and its optional challenges as yellow triangles:

I’ve run a few House of Danger games; I agree with his conclusiong that the game is a gamebook (rather than a classic CYOA) masquerading as a boardgame. His analysis of the market for board-gamebooks implies there are many more boardgame choicemaps to come.
2020 (Update)
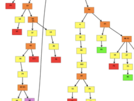
In 2020, Andy Looney remapped Life’s Lottery, without mention of Callum MacKendrick’s exhaustive flowchart above. In a hand-drawn map, he takes the historically rare approach of labelling arrows instead of nodes, with the nodes retaining only the paragraph numbers from the book. His labels are necessarily brief and give away vanishingly little of the plot, but his plan to further remove spoilers from the full map by omitting terminal squiggles in the spoiler-free version of the map and addendum just pushes the spoiler up one node in most cases. More successful features include special handling of node 13, color-coding of clusters of nodes, and submaps for a few of the clusters.

References
The Wayback Machine has been enormously helpful in this project (though it helps if you remember where websites used to be), as have Google Images, the Yahoo gamebooks mailing list (now offline due to the destructive implosion of Yahoo Groups), Demian’s site in general, and Demian’s file list with timestamps. (See also Demian’s partial list of structure diagrams in the database—scroll down.) The Encyclopedia of Science Fiction has good articles on gamebooks and the CYOA series.
James Ryan is threatening to write a paper about Consider the Consequences!
≪ Previous | Next ≫


